Personal Strategy®
A strategy as unique as you are
A strategy as unique as you are
Personal Strategy® is a globally diversified multi-asset class portfolio built with individual stocks and ETFs, designed and managed specifically for you.
Personal Strategy® is a globally diversified multi-asset class portfolio built with individual stocks and ETFs, designed and managed specifically for you.

1.
Portfolio building
Portfolio building
All our model portfolios utilize our proprietary Smart Weighting™ methodology and are designed to maximize return for a given level of risk.
2.
Strategy selection
Strategy selection
Your portfolio personalization starts with our strategy selection algorithm, driven by factors that are unique to you.
3.
Dynamic portfolio allocation
Dynamic portfolio allocation
We implement and maintain a dynamic portfolio allocation for you that changes over time as your financial situation evolves.
4.
Monitoring and maintenance
Monitoring and maintenance
We monitor your portfolio and make adjustments as needed. This includes disciplined rebalancing, and tax optimization strategies such as tax loss harvesting.
Advantages of your Personal Strategy
Advantages of your Personal Strategy
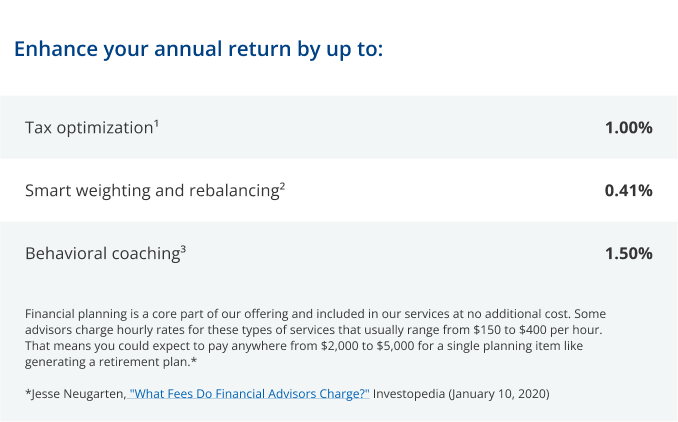
Tax optimization
Tax optimization
Our sophisticated tax-optimization process focuses on three key areas: asset location, tax-loss harvesting and tax efficiency.
Disciplined rebalancing
Disciplined rebalancing
We review portfolios daily for rebalancing opportunities. This provides the potential for enhanced returns by creating a systematic way of buying low and selling high.
Smart Weighting™
Smart Weighting™
Smart Weighting provides more even exposure to factors such as size, style, and sector, potentially providing better diversification for your portfolio.
Dedicated advisor
Dedicated advisor
Your own dedicated financial professional will be there along the way to help with financial planning needs and behavioral coaching.
Our benefits
Our benefits
What do you have to gain by choosing Empower as your wealth management partner? Here’s a cost-benefit analysis of our personalized approach to wealth management.
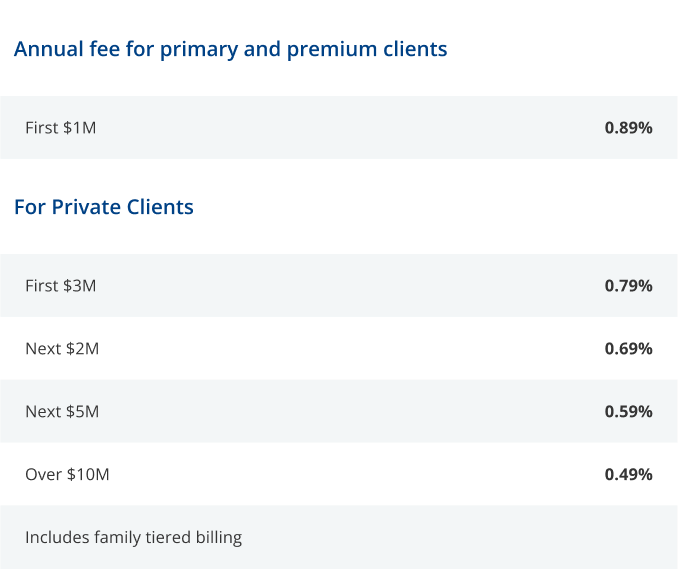
Our fee structure
Our fee structure
There are no hidden fees, no trailing fees and no trade commissions.
1 Rushkewicz, Katie. “How Tax-Efficient is your Mutual Fund?” 15 February 2010. Morningstar. 17 January 2011; Vanguard Study, https://personal.vanguard.com/pdf/ISGTEEI.pdf [personal.vanguard.com]. Average tax cost is calculated based upon Morningstar data for all domestic equity stock funds with 15 years of performance history as of September 30, 2014. Calculations assume account is not liquidated at the end of the period. When after-tax returns are calculated, it is assumed that an investor was in the highest federal marginal income tax bracket at the time of each distribution of income or capital gains. State and local income taxes are not reflected in the calculations. After-tax distributions are reinvested, and all after-tax returns are also adjusted for loads and recurring fees using the maximum front-end load and the appropriate deferred loads or redemption fees for the time period measured.
2 We performed a hypothetical back-test using historical market returns from stocks in the S&P 500 and Russell 2000 indexes. Based on available data, the hypothetical results are time-linked equal returns of size, style and sector indexes. From 1991 to 1995, results are calculated using an average of equal weighted S&P sectors and an equal weight of the S&P 500 and Russell 2000. From 1996 to present, results are calculated using an average of equal weighted S&P sectors and the nine Russell Style box indexes. Results assume the reinvestment of dividends. These retroactive results do not include the effects of cash flows, fees, commissions or taxes, all of which would have affected the returns. For the combination of SW and rebalancing, the new benefit is 0.44%, and this is based on the annualized return of SW that is 10.8%, and the S&P annualized return of 10.2%. This is for the period of 12/31/1990 to 12/31/2022. Taking this 0.6% difference and assuming a 55% US equity weighting for a growth strategy, the potential annualized benefit is 0.41% when combined with the 0.08% benefit from rebalancing.
All investments are subject to the risk of loss. This information is intended only to illustrate a potential index strategy. Past returns are no guarantee of future performance. There can be no assurance that any strategy will be profitable, or that the equal weighting approach described above will perform better than the S&P 500 or other market-weighted index. Actual results for Personal Capital’s Composite Personal Strategies are available upon request.
We performed a hypothetical back-test using historical market returns for the six major liquid asset classes: U.S. stocks, international stocks, US bonds, international bonds, alternatives and cash. We then selected six of the commonly utilized model client asset allocations, ranging from highly aggressive to conservative, and ran a performance analysis from 1970 to 2022. Two sets of returns were calculated for each asset allocation: one with annual rebalancing and one without. Out of all portfolio outcomes, the annually rebalanced portfolios generated a performance benefit of up to 0.1%.
3 Vanguard Advisor’s Alpha: “Quantifying your value to your clients”; https://advisors.vanguard.com/iwe/pdf/FASQAAAB.pdf [advisors.vanguard.com]
For EAG’s current Form ADV Part 2A: Click Here